Another beta update is out, now with a grid of the entire year’s uploads!
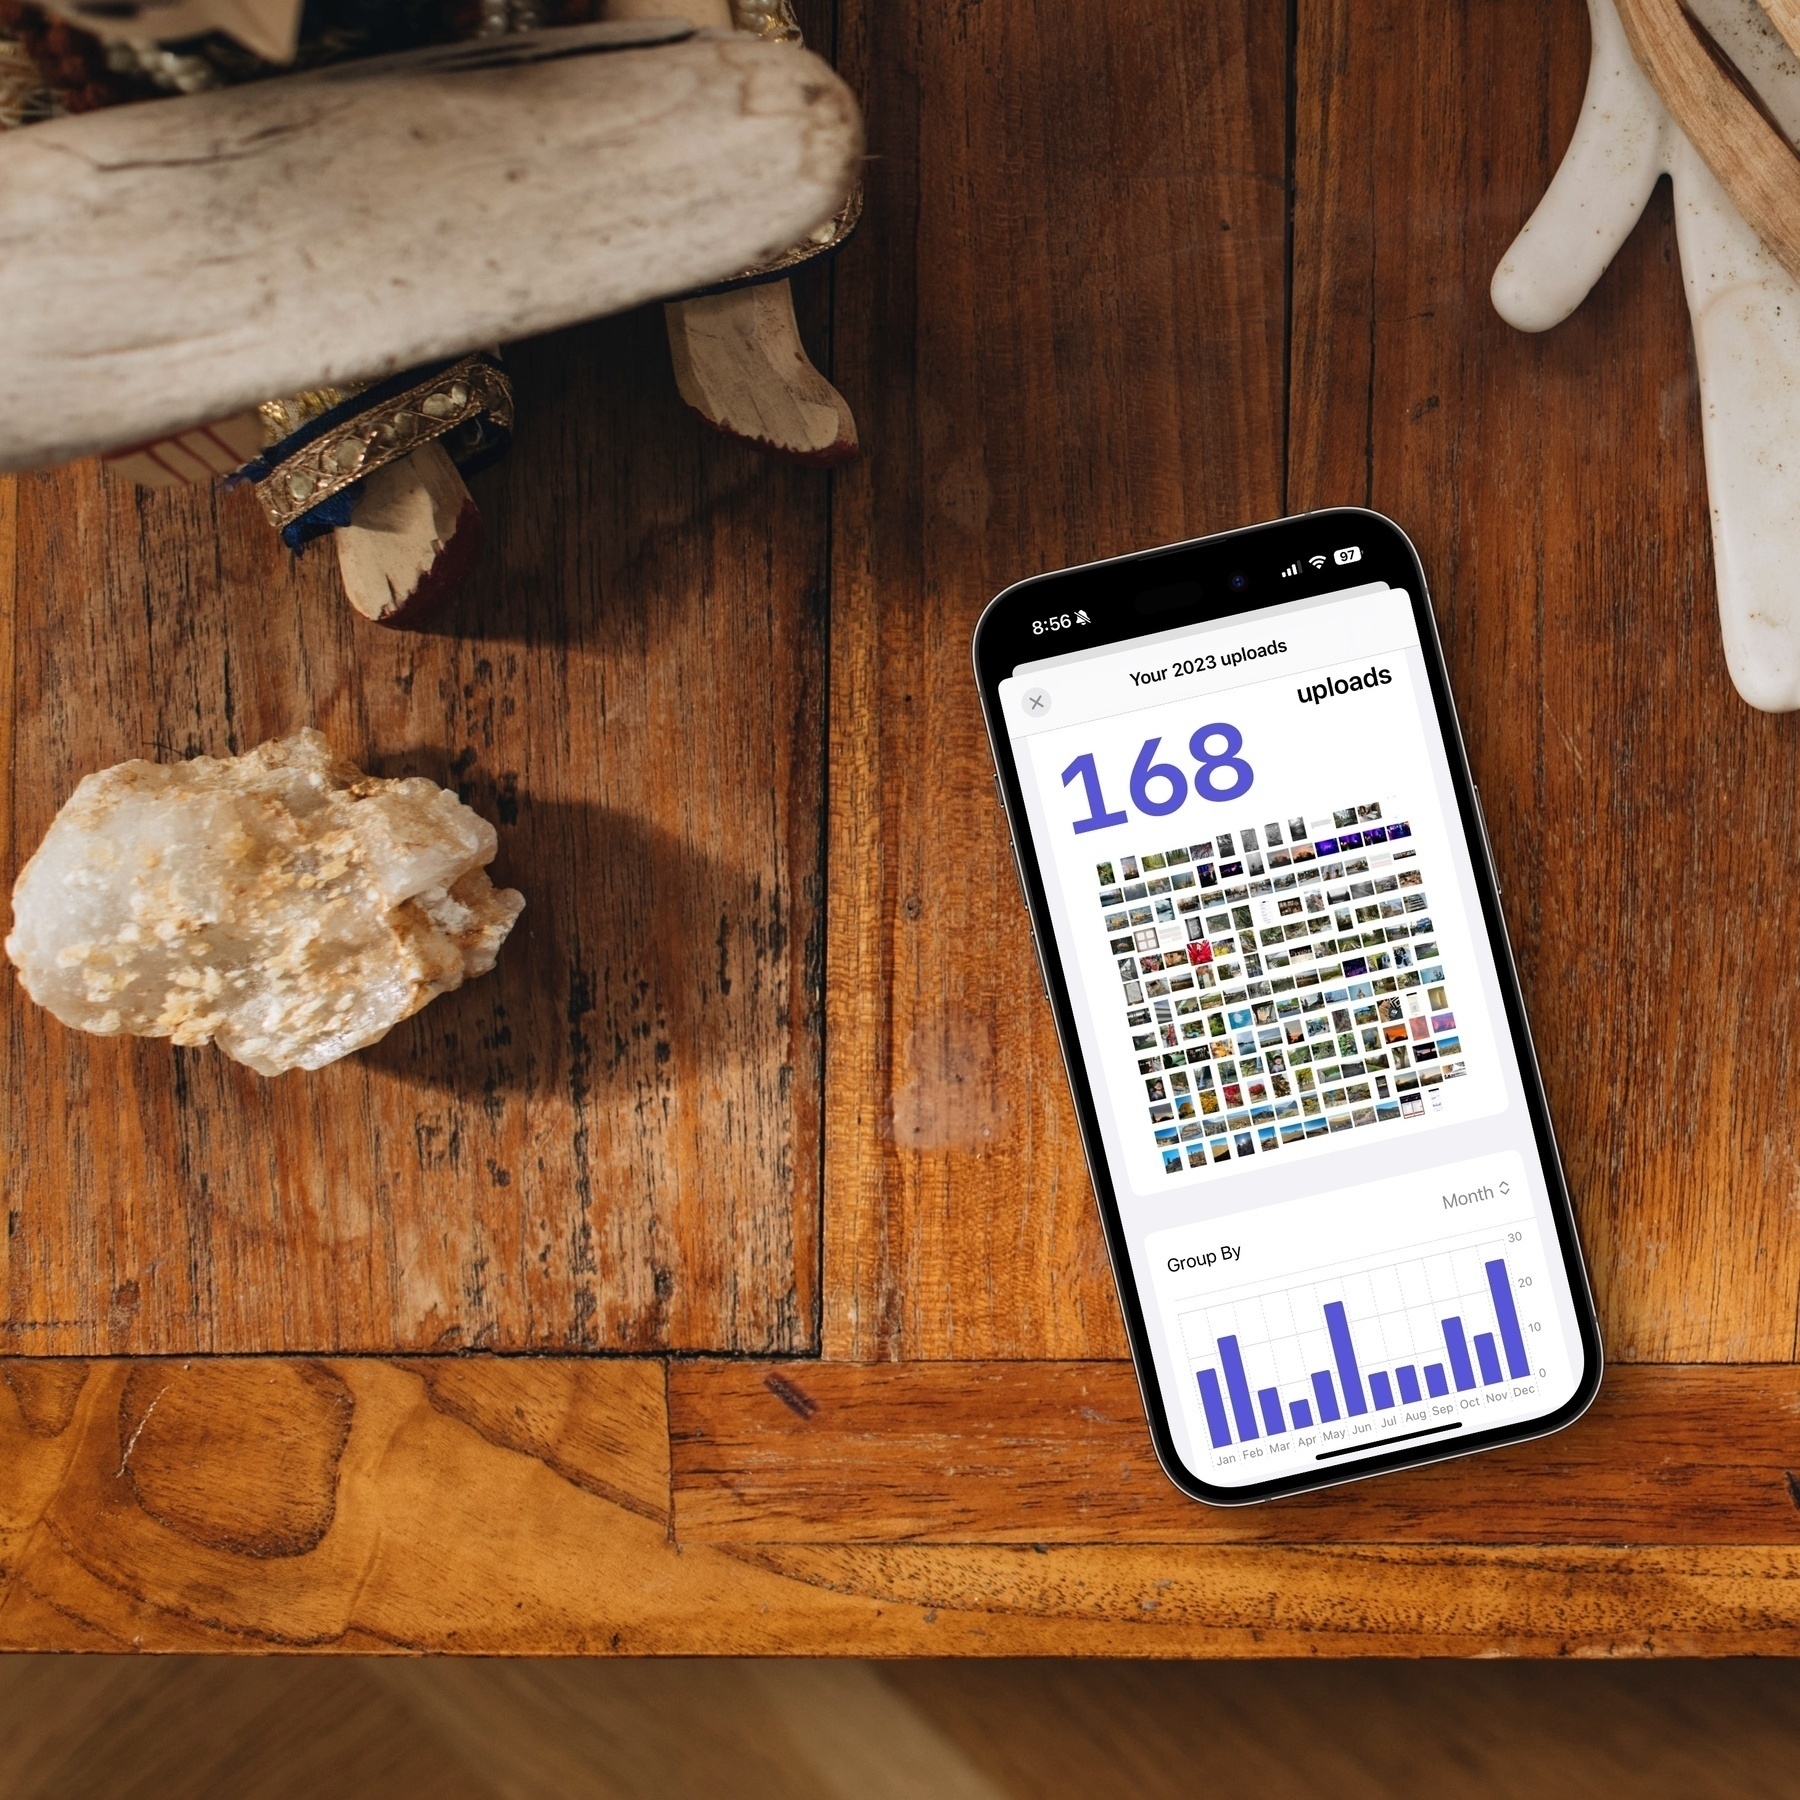
Caveat: This might take a while to generate, and may be too tiny if you have a lot of images! : samgrover.micro.blog
Another beta update is out, now with a grid of the entire year’s uploads!
Caveat: This might take a while to generate, and may be too tiny if you have a lot of images! : samgrover.micro.blog
@samgrover Loving these updates. Do these stats measures uploads via Mimi or for Micro.blog, regardless of how you upload images? For some reason my 2023 looks weird but 2022 was just fine.
@samgrover All Micro.blog makes sense. @maique beat me to the first weird part. The four-digit count show up weird.
I realized, the other weird is me-specific since I moved photos from my photoblog to my main blog in April and my other blog last month so the graph looks weird.
@samgrover looks exciting. I’ve been looking forward to trying some of the new features and only just learned of the supporter option so signed-up now.
@jemostrom @maique I’m curious why I don’t see more images in your grids. Do you have many non-image uploads? Or I wonder if @manton is throttling large number of small image requests.
@pratik I agree that it isn’t much by itself. It’s a start that I wanted to get out there before the end of the year. I have several thoughts on how I can improve this screen, including a grid customization interface, grids based on groupings the chart offers, exporting grid image to share, etc. It’s one of those things that I will slowly improve over time because it can easily be a time sink.
@samgrover There’s no throttle specifically for images, but if there are lots of simultaneous requests it might cause problems. Be gentle on the servers if you can. 🙂

